GEO Metrics: How to Measure Generative Engine Optimization Performance
The question everyone running a GEO program eventually asks is the same one that comes up in any discipline: is this working?
For traditional SEO, measurement is imperfect but understood. You check rankings, watch organic traffic, monitor GSC impressions. The data has gaps, but at least you know what you're measuring and where to find it.
GEO measurement is different enough that it requires a fresh mental model. There are no rankings in AI-generated answers. No impressions. No clicks logged by the AI engine. When Perplexity cites your brand in a synthesized answer, nothing in your analytics stack records it automatically. The buyer who found you that way shows up in your GA4 as a direct or referral visit at best — or doesn't show up at all, because they haven't clicked yet.
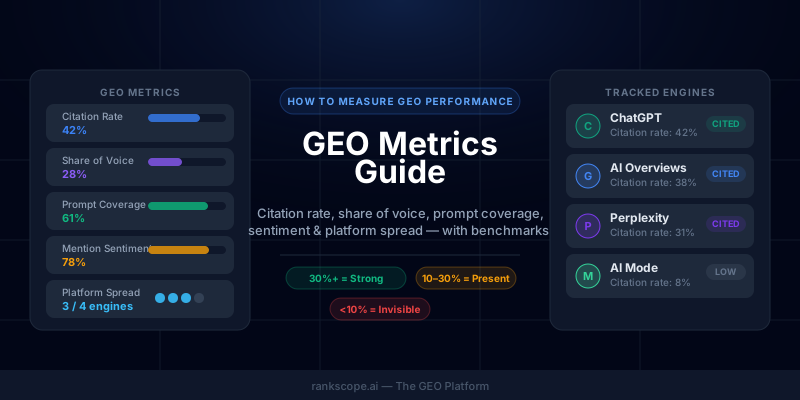
This guide covers the five core metrics for measuring GEO performance, the methodology for calculating each one correctly, the benchmarks that tell you whether your numbers are good or bad, and the measurement mistakes that produce bad data.
Why GEO Measurement Is Different
Before getting into metrics, it's worth being precise about what makes GEO measurement structurally different from SEO measurement — because the differences determine the methodology.
AI citations are probabilistic, not deterministic. Ask Google "best project management tools" and the results are identical for everyone in the same location. Ask ChatGPT the same question and you'll get a somewhat different response next time you try it. AI engines sample from their retrieval and generation systems, so responses vary between sessions, users, and sometimes minutes. This means a single check of whether your brand appears is statistically meaningless. You need to run prompts many times to get a citation rate with any statistical weight.
The channel is active, not passive. Traditional SEO measures what happens after someone finds you. GEO measures whether someone finds you in the first place — inside a synthesized response where your brand either appears or doesn't. It's closer to measuring whether a sales rep is mentioning your product in calls than to measuring website traffic.
The data lives inside the AI engine. To measure GEO performance, you have to query the AI engines directly. You can't infer your citation rate from your web analytics. You have to ask ChatGPT the question, record what it says, and repeat.
This isn't harder than traditional SEO measurement. It's just different. Once you accept that the methodology is about querying engines and recording citations, the rest follows logically.
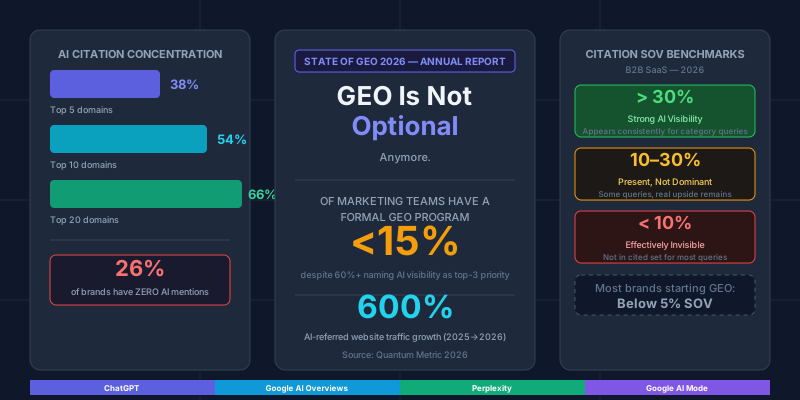
For context on how GEO fits into the broader AI search landscape, see our complete guide to generative engine optimization. For the underlying data on citation patterns and platform growth, the State of GEO 2026 report has current benchmarks from across the category.
The Five Core GEO Metrics
1. Citation Rate
What it measures: The percentage of relevant AI responses that mention your brand.
Formula: (Responses mentioning your brand ÷ Total responses tracked) × 100
Example: You track 50 responses to the prompt "what tools help teams track their brand in AI search?" across ChatGPT. Your brand appears in 12 of those 50 responses. Your citation rate for that prompt on ChatGPT is 24%.
Citation rate is the most fundamental GEO metric. It tells you, in the most direct terms, whether AI engines are including your brand when answering questions buyers in your category actually ask.
A high citation rate means your brand has cleared whatever threshold a given AI engine uses to include brands in synthesized answers — your content is being indexed, your entity signals are strong enough to be associated with the topic, and your positioning is legible enough for the AI to decide you belong in the answer.
A low citation rate means something in that chain is broken. The AI either can't find enough authoritative content about you, can't reliably associate you with the right topics, or has more than enough alternatives to fill the answer without you.
Citation rate by prompt vs. citation rate in aggregate
You'll want to track both. Per-prompt citation rate tells you which queries your brand wins and which ones it loses. Aggregate citation rate across your entire prompt library tells you your overall presence.
The per-prompt breakdown is where GEO strategy happens. If you're cited on 60% of "how to track AI brand mentions" prompts but 3% of "best tools for ai search visibility" prompts, that points to a specific gap: you're being indexed for the monitoring topic but not the visibility tools category. That gap translates directly into content work. For a full breakdown of what AI search visibility is, how it differs from traditional search visibility, and the benchmarks to aim for, see our dedicated guide.
Benchmarks
There is no published benchmark for what a good citation share is, from us or anyone else we have found, and it depends heavily on how many brands compete for the same prompts. Compare yourself with named competitors on a fixed prompt set, and track the direction over time.
These benchmarks vary by category. In less competitive B2B niches, a 15% citation rate might represent category dominance. In highly competitive spaces with ten or more well-established brands, 25% might be genuinely strong performance.
2. Share of Voice (AI)
What it measures: Your brand's citations as a percentage of all brand citations across your competitive set.
Formula: (Your brand citations ÷ Total citations across all tracked brands) × 100
Example: Across 100 tracked prompts, AI engines collectively cited brands in your category 380 times. Your brand was cited in 68 of those responses. Your AI share of voice is 18% (68 ÷ 380 × 100).
Citation rate and share of voice measure different things. Citation rate is absolute — it tells you how often you appear. Share of voice is relative — it tells you how you stack up against competitors.
You can have a 40% citation rate (impressive in absolute terms) but a 7% share of voice if a dominant competitor is capturing 65% of all citations. That's a very different strategic situation than a 40% citation rate with a 40% share of voice.
Share of voice is useful for three things:
Competitive positioning. It tells you whether you're gaining or losing ground relative to the market, independent of whether the category is growing.
Resource allocation. If your share of voice for "AI visibility tools for agencies" is 4% but your share for "how to track AI citations" is 35%, that tells you which prompts to prioritize in your content work.
Investor and stakeholder reporting. SOV is a familiar metric for marketing teams and boards. Reporting your AI citation share of voice alongside traditional SEO metrics tells a complete story of your brand's market presence.
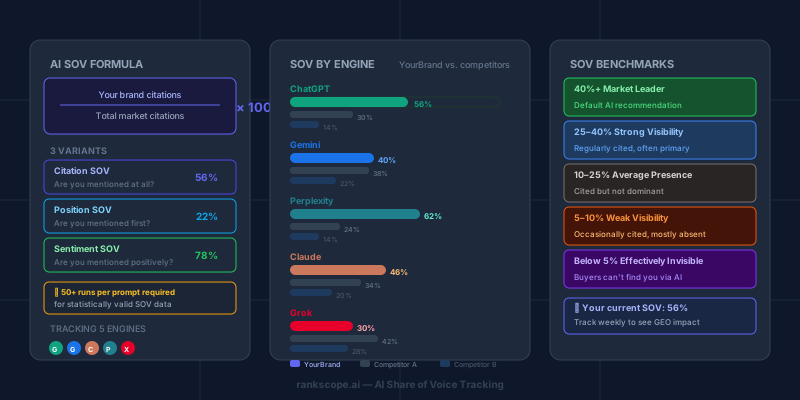
For a detailed breakdown of share of voice calculation, including how it differs across ChatGPT, Perplexity, Gemini, Claude, and Grok, see our dedicated guide: How to Calculate Share of Voice in AI Search. For the broader context of how AI SOV fits alongside paid, organic, and social share of voice, see our complete guide to share of voice in marketing.
3. Prompt Coverage
What it measures: How many of your tracked prompts trigger at least one citation of your brand.
Formula: (Prompts where your brand appeared ≥ 1 time ÷ Total prompts tracked) × 100
Example: You track 40 prompts. Your brand appears at least once in the results for 22 of those prompts. Your prompt coverage is 55%.
Prompt coverage is different from citation rate in a subtle but important way. Citation rate tells you what percentage of all responses include you. Prompt coverage tells you how many distinct topics or query types you're visible for.
A brand with 30% citation rate across 5 prompts and 8% citation rate across 40 prompts might look similar on citation rate if you only look at aggregates — but the second brand has far worse prompt coverage. It's invisible for the vast majority of questions buyers ask.
Prompt coverage matters because buyers research using many different prompts. They ask about categories, use cases, specific problems, comparisons. A brand that appears consistently for one narrow prompt type ("AI citation tracker") but is invisible for adjacent prompts ("how to monitor my brand in ChatGPT," "AI search visibility tools," "track my brand in AI Overviews") has a coverage gap that will limit its reach.
High prompt coverage with moderate citation rate is often better than high citation rate with low coverage. It means your brand has the topical breadth to appear across buyer research journeys, even if you're not the dominant citation on any single prompt.
4. Mention Sentiment
What it measures: Whether AI engines frame your brand positively, neutrally, or negatively when they cite you.
Formula: Categorize citations as positive, neutral, or negative. Track the percentage in each category over time.
Not all citations are equal. An AI engine might cite your brand as:
- "Brand X is the most-used tool for [category]" — positive framing
- "Brand X is an option for teams looking for [feature]" — neutral framing
- "Brand X is popular but some users find it expensive for smaller teams" — negative framing with qualification
- "Brand X has faced complaints about [specific issue]" — negative framing
A high citation rate with predominantly negative sentiment is worse than a lower citation rate with positive sentiment. You're being named, but in a context that reduces rather than increases the likelihood of conversion.
Where negative sentiment comes from
AI engines synthesize content from across the web. If negative reviews on G2 or Reddit are prominent in your category, they can surface in AI answers. If a competitor's blog has content positioning you as "good but limited," AI systems might absorb that framing.
Negative AI sentiment is a signal to investigate: what content is being cited that produces this framing? Review sites, competitor comparisons, or community discussions are the usual sources.
How to track it
Manually reviewing sentiment for each citation is straightforward but time-consuming. You read each AI response, note how your brand is framed, and categorize it. For scale, automated tools that apply sentiment analysis to AI responses handle this faster and more consistently.
Track sentiment as a monthly percentage breakdown. The goal is not to eliminate neutral citations (neutral is fine) but to watch for shifts toward negative framing that signal a reputational problem in the AI ecosystem.
5. Platform Spread
What it measures: How many of the major AI engines cite your brand above a meaningful threshold.
Formula: Count of AI engines where your citation rate exceeds 10% (or your defined threshold).
The four AI engines most worth measuring for brand discovery in 2026 are ChatGPT, Google AI Overviews, Perplexity, and Google AI Mode. A brand with strong citation performance on all four has platform spread. A brand with 45% citation rate on Perplexity but near-zero on Google AI Overviews has platform concentration risk.
Platform concentration is a strategic vulnerability. Each AI engine retrieves content through different mechanisms, has different freshness biases, and weights different types of authority. If you're concentrated on Perplexity because your recently-published content gets picked up quickly by their aggressive crawler, that advantage can disappear if a competitor produces more content or if Perplexity updates its retrieval.
Why each platform matters differently
- ChatGPT is the highest-volume AI search platform. Citation here reaches the broadest audience, but ChatGPT's web search relies on Bing's index, so it rewards brands with strong Bing visibility.
- Google AI Overviews is embedded in Google Search, where most research still begins. Being cited here connects your brand to the highest-intent searches, the ones that start in the search bar.
- Perplexity has a research-oriented user base that tends to be in active evaluation mode — these are buyers who are specifically trying to make decisions. Perplexity citation is high-intent.
- Google AI Mode is the emerging AI-native interface for Google Search, distinct from AI Overviews. It's growing fast and rewards structured, authoritative content.
Tracking platform spread tells you whether your GEO program is working across the full discovery landscape or creating a partial picture. A score of 3 out of 4 platforms is solid; 2 out of 4 means significant blind spots; 1 out of 4 means platform dependence.
How to Build a GEO Measurement System
Having the five metrics is only useful if you have a system for measuring them consistently. Here's how to build one. Note that the mechanics of running prompts, calculating citation rate, and structuring your tracking setup are covered in depth in the AI rank tracker guide — that post focuses specifically on the execution side of measurement.
Step 1: Define Your Prompt Library
Your prompt library is the set of queries you'll use to measure GEO performance. These prompts need to represent real buyer behavior — the actual questions people ask when they're researching your category.
What to include:
- Category prompts: "Best tools for [your category]," "Top [your category] platforms," "What [your category] tools do teams use?"
- Use-case prompts: "How do I [specific use case your product solves]?" "What's the best way to [buyer pain point]?"
- Comparison prompts: "What's the difference between [approach A] and [approach B]?" "Alternatives to [established competitor]"
- Problem prompts: "How do I track [specific metric or outcome]?" "How do I know if [category result] is working?"
What to avoid:
Branded prompts ("tell me about [your brand]") shouldn't be in your citation rate library. They measure awareness of your brand, not how buyers discover it. Track them separately for sentiment monitoring if you want that data, but don't include them in your core GEO metrics.
For most categories, 20–40 prompts is enough to get representative coverage. More prompts give you more granular data; fewer is faster to run.
Step 2: Establish Your Sample Size
This is the part most teams get wrong. Running a prompt once and checking if your brand appears is not measurement. It's anecdote.
AI engines vary their responses. A single run might say your brand appears (or doesn't) because of a specific sampling path through the retrieval system that won't be reproducible. To get a statistically meaningful citation rate, you need volume:
- Minimum viable: 10 runs per prompt per engine — gives directional data, but with high variance
- Recommended: 30–50 runs per prompt per engine — low enough variance to see real trends
- High fidelity: 50+ runs per prompt per engine — suitable for making content investment decisions
For a library of 30 prompts across 4 engines at 30 runs each, you're looking at 3,600 total responses to collect and analyze. This is not practical manually for most teams — it's why automated GEO tracking tools exist.
Step 3: Define Your Competitive Set
Share of voice requires a competitive set. Choose 3–8 brands that buyers in your category would naturally compare you against. These should be the brands AI engines routinely group you with.
Don't include irrelevant or tiny competitors to inflate your share of voice. Don't exclude dominant competitors because tracking them is uncomfortable. The goal is an accurate picture of the competitive landscape.
Keep your competitive set consistent across measurement periods. If you change it, your SOV data is no longer comparable to prior periods.
Step 4: Establish Your Baseline
Your first measurement gives you a baseline: your starting citation rate, SOV, coverage, sentiment, and platform spread before any optimization work. This baseline is the reference point everything future is measured against.
A baseline measurement is useful even if the numbers are discouraging. Knowing you have a 4% citation rate and 8% SOV across 12% of your tracked prompts on one engine is far better than not knowing. It tells you exactly where you stand, which gaps are biggest, and which prompt clusters are worth targeting first.
Step 5: Run Monthly Tracking and Interpret Trends
Measure on a regular cadence — monthly is the practical minimum. When you run your prompt library consistently, you can track:
- Whether overall citation rate is increasing or decreasing
- Which prompt clusters are improving after content work
- Whether competitors are gaining or losing share
- Whether sentiment is shifting
The lag issue: Changes you make today won't show up in your metrics immediately. Publishing a new structured guide doesn't update AI citation behavior overnight. Allow a 2–4 week window after any significant content change before expecting to see metric movement. Some AI engines (particularly Perplexity, which crawls aggressively) update faster; others update over weeks.
The goal of monthly tracking is to see trends over quarters, not week-to-week changes. GEO is a compounding discipline — the brands that build topical authority over months have citation rates that are very hard for newer entrants to displace.
The Supplementary GEO Metrics
Beyond the five core metrics, a few supplementary measurements add useful context.
Citation Source Breakdown
Which specific pages on your site are generating citations? If your /blog/what-is-geo post is cited in 60% of your category prompts but your /platform page almost never appears, that's a structural signal worth acting on.
Audit the high-citation pages: what makes them citable? Usually it's direct answers at the top of sections, high factual density, clear entity signals, and structured content that AI can extract cleanly. Apply those characteristics to pages that aren't being cited.
Position in Response
Being cited isn't binary — there's a difference between being the first brand named (the default recommendation) and being mentioned fourth in a list. Earlier citation positions carry more weight: users read top-to-bottom, and AI-generated lists often mirror implicit recommendation hierarchy.
Track position separately from citation presence. A brand with 30% citation rate but 5% position-1 rate is being named regularly but rarely as the primary recommendation. That's a different GEO problem than low citation rate — the issue is framing and topical authority, not basic discoverability.
Prompt Coverage by Query Cluster
If you organize your prompts into clusters (category queries, use-case queries, comparison queries, problem queries), you can measure coverage per cluster. This tells you whether your gaps are in discovery (you're not found on basic category queries), consideration (you're found but not on comparison queries), or evaluation (you're found on broad prompts but missing on specific feature/capability queries).
Different coverage gaps need different content fixes:
- Low coverage on category queries: your basic entity signals and category content need strengthening
- Low coverage on comparison queries: you need more comparison content and third-party roundup mentions
- Low coverage on use-case queries: you're not addressing specific buyer pain points with enough depth
GEO Metrics and Traditional SEO Metrics: How They Relate
These two measurement systems aren't separate — they inform each other.
Traditional SEO feeds GEO. If you rank well in Google Search, you're more likely to be cited in Google AI Overviews and AI Mode. Google's search authority is a significant input signal for how AI systems evaluate brand trustworthiness. A brand with strong domain authority and well-ranked pages is easier for AI engines to cite confidently.
This means your traditional SEO metrics — organic rankings, domain authority, backlink profile, Core Web Vitals — still matter for GEO. They're not sufficient on their own, but they're part of the foundation.
GEO surfaces content gaps traditional SEO doesn't see. AI citation gaps often point to missing or thin content that traditional SEO tools wouldn't flag. A page might rank position 8 on Google for a query and have a 4% citation rate because its structure isn't right for AI extraction. The SEO metric says "ranking" — the GEO metric says "not being cited." Both are useful; neither is complete.
AI-referred traffic is measurable in GA4. Perplexity, ChatGPT, and some other AI engines do generate referral traffic when users click through sources. In Google Analytics 4, set up channel groupings to isolate AI-referred sessions separately from organic. This gives you a downstream view of which AI citations are converting to actual site visits.
Note that AI Overview traffic is reported in Google Search Console under Search type = Web but the click attribution is imperfect — many AI Overview citations that lead to clicks appear in GSC as regular organic clicks from the query, not as a separate AI category. GSC added some AI Overview click data in 2025, but it's still incomplete.
Common GEO Measurement Mistakes
Measuring Once
The most common mistake. Checking once whether ChatGPT mentions your brand tells you very little. AI response variability means a single run is noise. Measure across 30–50 runs minimum per prompt before drawing conclusions.
Tracking Only One AI Engine
Brands often default to measuring ChatGPT because it's the most visible. But ChatGPT, Perplexity, Google AI Overviews, and Google AI Mode retrieve content differently, weight sources differently, and return different citation patterns. Your ChatGPT citation rate may be 40% while your Google AI Overviews rate is 8%. Measuring only one engine gives you a partial and potentially misleading picture of your actual GEO health.
Using Branded Prompts for Core Metrics
"What is [your brand]?" and "Tell me about [your brand]" are useful for monitoring how AI engines describe you, but they shouldn't be your citation rate prompts. Every AI engine will mention your brand in response to a direct question about it — that's not a citation, it's a lookup. Your core prompts should be unbranded discovery queries that simulate how buyers actually find brands.
Ignoring Competitor Citations
Measuring only your own citation rate, without tracking what competitors appear in your place, gives you half the picture. The value in GEO measurement comes from knowing which brands are cited when you're not, what content they're being cited from, and what the gap between their citations and yours tells you about your content strategy.
Treating GEO Metrics as Vanity Metrics
Citation rate is a leading indicator, not an end goal. A 50% citation rate that doesn't correlate with any change in pipeline or revenue is interesting but not valuable. Where possible, connect your GEO metrics to downstream data: are AI-referred sessions converting? Is your brand appearing in the research phase of deals that close? The closer you can get GEO metrics to business outcomes, the more useful they become for resource allocation decisions.
Setting Up GEO Measurement: Manual vs. Automated
Manual Measurement
For initial baselines or small prompt libraries (10–15 prompts, one or two engines), manual measurement works. The process:
- Open the AI engine in incognito or a fresh session (to avoid personalization bias)
- Run your prompt, record whether your brand appears, what position, and what competitors were cited
- Repeat 20–30 times for each prompt
- Aggregate into a spreadsheet, calculate citation rate and SOV
Manual measurement is free and gives you direct familiarity with how AI engines actually respond to your category queries. The tradeoff is time: 30 prompts × 4 engines × 30 runs = 3,600 manual queries. At 1–2 minutes per query, that's 60–120 hours per measurement cycle.
Automated Measurement
For any program at scale — more than a handful of prompts, more than one engine, or any cadence more frequent than quarterly — automation is necessary. Platforms like RankScope run your prompt library across all four major AI engines on an automated schedule, record every citation, and track trends over time without manual query running.
The practical case for automation isn't just time savings. It's consistency: automated tools run the same prompts at the same times with no human variation in how prompts are entered or how results are interpreted. That consistency is what makes trend data reliable.
For a comparison of AI visibility tools and what each tracks, see our guide to AI brand monitoring tools. For a deeper look specifically at the brand tracking methodology, see How to Track Brand Mentions in AI Search. For the full picture of how ongoing LLM monitoring works — including how to set up a monitoring workflow and what metrics to track over time — see our guide to LLM monitoring.
What GEO Metrics Can't Tell You
Measurement clarity is useful, but it's worth being honest about what these metrics don't capture.
They don't measure buyer intent quality. A citation on "best tools for [your category]" from a buyer actively evaluating vendors is worth more than a citation on a tangentially related query from a casual browser. Citation rate and SOV don't weight prompts by buyer intent. You can account for this by tracking high-intent prompts separately.
They don't capture zero-click interactions. A buyer might read an AI response that includes your brand, decide you're the right fit, and navigate directly to your site without ever clicking a cited link. That journey looks like direct traffic in your analytics. GEO metrics capture whether the citation occurred, not whether the buyer acted on it.
They don't track all AI surfaces. Beyond the four major engines, AI is embedded in search features, email clients, productivity tools, and enterprise software. Most of those surfaces don't have structured APIs for tracking citations at scale.
These gaps don't undermine the value of GEO metrics — they're just the honest boundaries. The five core metrics give you directional accuracy on the question that matters most: is your brand part of the conversation when buyers use AI to research your category?
GEO Metrics Summary Table
| Metric | Formula | Good Benchmark | Why It Matters |
|---|---|---|---|
| Citation rate | Citations ÷ Total responses × 100 | Relative to named competitors on the same prompts | Core visibility measure |
| Share of voice | Your citations ÷ Total category citations × 100 | >20% in competitive category | Competitive position |
| Prompt coverage | Prompts with ≥1 citation ÷ Total prompts × 100 | >50% = broad coverage | Topic breadth |
| Sentiment score | Positive citations ÷ Total citations × 100 | >70% positive | Citation quality |
| Platform spread | Engines with >10% citation rate | 3+ of 4 engines | Resilience |
Getting Started
If you're just starting to measure GEO performance, the order of operations is:
- Build a 20-prompt library covering your main category queries
- Run it manually across ChatGPT and Perplexity (the two most accessible engines) for a quick baseline
- Record your citation rate and the top competitors being cited in your place
- Use those citation gaps to identify your highest-priority content work
- Set up monthly tracking so you can measure whether content changes are moving the needle
The first measurement is usually sobering — most brands start with very low citation rates. That's not a failure; it's the honest starting point. The value of GEO metrics is in the direction and velocity of change over time. Build the baseline, do the work, measure again in 30 days.
For the broader GEO strategy framework — what content to publish, how to structure it for AI extraction, and how the major platforms differ in their retrieval behavior — see our complete guide to generative engine optimization. If you're ready to turn those foundations into an active program, our GEO strategy playbook walks through the 5-step cycle — baseline, prompt library, gap analysis, before-and-after tracking, and engine-specific iteration.
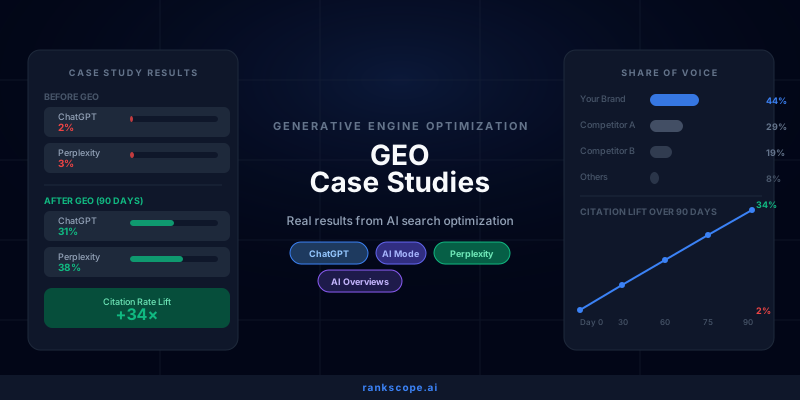
Want to see what these metrics look like in practice? Our GEO case studies walk through before-and-after measurement on real programs.
The measurement system in this guide tells you whether your GEO program is working. Everything else is the work itself.